Monday, April 8, 2013
Experiment 4: Standing Waves
Objective:
To make different nodes and oberve the difference for standing waves on a string.
Equipment:
To make different nodes and oberve the difference for standing waves on a string.
Equipment:
Pasco variable frequency wave driver
String
Pasco student function generator
Weight set (grams)
Pendulim clamp
Pulley
Digital Multimeter
Meter stick
String
Pasco student function generator
Weight set (grams)
Pendulim clamp
Pulley
Digital Multimeter
Meter stick
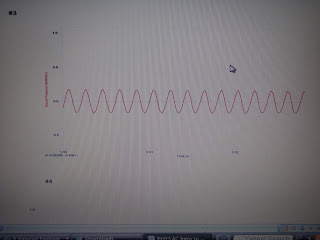
Procedure: We took measurements mass, and length of the string. We then took measurements of harmonics. We got different levels of harmonics from changing the frequency of the function generator. We did this in two different cases. When doing the second case it is one-fourth the original
tension.
Data:
Sunday, April 7, 2013
Experiment 2: Fluid Dynamics
Procedure: Refer to lab manual for procedure.Data:
Conclusion:
Theoretical time was 14.3 s, and an error table of each run is shown below.
According to the measured data, they are within uncertainty except for the 6th
run.
Conclusion:
All data was within certainty except for the last run. The percent error for the drill bit was 0.057%.
Saturday, April 6, 2013
Experiment 1: Fluid Statics
Experiment 1: Fluid Statics
In this experiment we used three different ways to find the buoyant force.
A.) The underwater weighing method
We first draw a free body diagram
Calculations using buoyant force expressions:
B_F = mg - T
Then we found the force (mg) of the metal cylinder which had a
reading of 1.102N
Next we Submerged the cylinder in water for the tension which turned out to be 0.742N
Using the buoyant force expression above:
B_F = 1.102-.742= 0.360N
B) Displaced Fluid
Method
The mass of the dry beaker= 0.14016
kg
We then used a graduated cylinder, filled it with water to the very top, and then the graduated cylinder was placed inside the beaker. Then the metal cylinder was then placed inside the graduated cylinder and it caused the water to over flow into the beaker.
The mass of the beaker and the
water= 0.17790kg
Water mass measured to be
0.17790-0.14016= 0.03774kg
(water mass) X (gravity)
= Buoyant Force
.03774 kg X 9.8 (m/s^2) =
.370N
C) Volume of Object
Method
The Volume of the cylinder is V = Pi*((d/2)^2)h
d = diameter h = height.
When using a vernier caliper we got the following values
h = 0.076m; d = 0.0253m
V= 3.82 X 10^-5 m^3
Expression for the weight of the displaced water
W_F = ρ*V*g
ρ = density of water
V
= volume of the cylinder
g = gravity
W_F = 1000 kg/m^3 X 0.0000382 m^3 X
9.8 m/s^2 = 0.374N
2) Because of the value of uncertainty, the second
method is the most precise. This is where we used the
balance in the lab, and it is more accurate than the force
sensor and caliper. The displacement method doesn’t have much error.
3) When the metal cylinder is touching the bottom of the beaker in the first part, the buoyant force would have been minimized. The cylinder would have a normal force pointing up caused by the beaker. The smaller buoyant force balance's out the weight of the cylinder.
Sunday, March 24, 2013
Experiment 3: Wavelength and Frequency
Objective:
To prove that there is a relationship between the period, and wavelength.
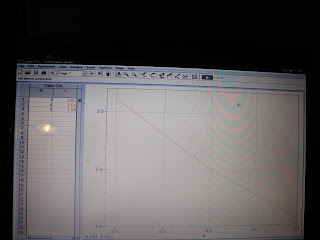
The spring was measured to get wavelengthin the video below. The data was used to plot a graph of frequency vs. wavelength to the relationship between them.
Conclusion:
From our results from the graph when wavelength increases it makes frequency decrease. This gives a negative slope. This resulting to a decreasing velocity. Errors in this lab might be the different tension was released.
To prove that there is a relationship between the period, and wavelength.
Procedure:
The spring was measured to get wavelengthin the video below. The data was used to plot a graph of frequency vs. wavelength to the relationship between them.
Data:
Frequency vs. Wavelength Graph
Subscribe to:
Comments (Atom)


.jpeg)


